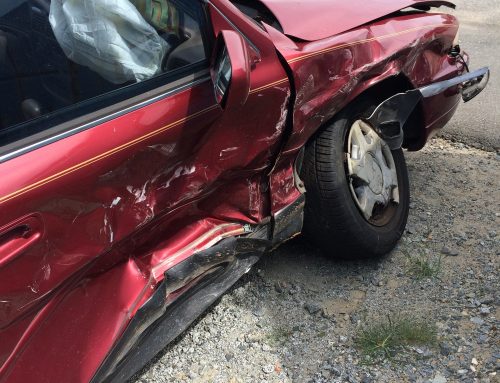
As car accident attorneys, we know that motor vehicle mishaps make up a significant amount of the personal injury claims in Florida annually. The same is true across the country, as over 38,000 people are killed annually in this type of accident. Although a grim topic, it is important to understand the gravity of the situation – car accident statistics point to the need not only to be more careful on the roads, but to understand what to do if you or a loved one is involved in a automobile accident.
These statistics are sobering, but you do not have to be a helpless victim. Check out our blogs on what to do after a car accident , ,then call Probinsky & Cole.
Safer-America.com recently updated their list of car accident statistics for 2020, compiled from data from the National Highway Traffic Safety Administration (NHTSA), the Centers for Disease Control and Prevention (CDC), and the Federal Motor Carrier Safety Administration (FMCSA)- here are some of the more telling results.
Types of Accidents
- In 2019, 38,800 people were killed in car accidents in the United States. These included fatalities of vehicle occupants, motorcyclists, and nonoccupants.
- 58 percent of police-reported fatal car accidents involved only one vehicle.
- 38 percent of all fatal car accidents originated from a collision with another motor vehicle.
- 40 percent of all fatal car accidents involved a fixed object – such as a tree or street sign – or a rollover type accident.
When They Occur
- Most fatal car accidents happen in the summer months of June through September.
- The highest percentage of fatal car accidents occurred on Saturday
- 48 percent of all fatal accidents took place after dark. Of these motor vehicle accidents, 41 percent occurred after dark, but lighted conditions.
Types of Vehicles Involved
- 95 percent of all vehicles involved in fatal car accidents were passenger cars or light trucks, such as SUVs or pickup trucks.
- Large trucks accounted for 8 percent of vehicles in fatal accidents.
- While 71 percent of large truck accidents involved semi-trucks, light trucks experienced the highest rollover rate in fatal car accidents, at 25.6 percent.
- Rollover accidents account for 18 percent of all fatal car accidents combined.
Types of Drivers Involved
- 50 percent of car accident fatalities involved the driver of the vehicle.
- 17 percent of the fatalities were passengers, while 16 percent were pedestrians, and 14 percent were motorcyclists.
- People in the 21 to 24 age demographic have the highest fatality rate per 100,000 motorists. The fatality rate for females is lower overall.
- 16-19-year-olds are involved in more fatal car crashes than any other age demographic. The male rate of fatality in that age group is twice as high as females.
- 48 percent of occupant fatalities in teens 16-19 were not wearing a seatbelt.
- Historically, people aged 65 years and older accounted for 18 percent of all traffic fatalities and 10 percent of all people injured.
- Only 8 percent of older drivers involved in fatal car accidents had blood alcohol levels of 0.08 or higher – the lowest percentage of all age groups.
- Although the majority of crashes occur at night, 74 percent of fatalities in crashes involving senior citizens occur during the day; 70 percent occurred on weekdays, and 67 percent involved other vehicles.
- Florida often has the highest number of fatalities of people 65 and older in the United States.
Car accident statistics involve people from all walks of life – and it is likely that you or someone you know has been involved in an accident at some point. If you feel that the accident – or the harm caused by it – was caused by negligent behavior of someone else, call Probinsky & Cole today. We are happy to help.


